In brief
We do the research, you get the alpha!

Disclaimer
The views and opinions expressed by the author are for informational purposes only and do not constitute financial, investment, or other advice.
$76,379.00
-2.91%$2,272.66
-1.71%$1.52
-0.86%$760.13
-2.42%$1.61
-0.63%$0.999668
0.00%$97.47
-6.33%$0.286244
0.96%$0.108339
0.30%$1.035
0.17%$53.81
4.36%$0.30151
1.17%$529.86
0.03%$0.999746
0.02%$8.81
2.23%$33.17
-11.34%$389.22
3.81%$9.69
0.25%$0.176345
-8.42%$0.998201
0.02%$0.177885
0.01%$0.999993
0.01%$60.72
0.99%$280.94
-3.17%$1.085
0.05%$10.12
0.18%$1.13
-0.56%$0.00000681
-0.84%$0.092776
1.47%$0.135838
4.66%$5,068.98
3.19%$0.999842
0.01%$1.39
1.07%$0.083063
0.25%$0.00913
-0.16%$1.47
-1.09%$3.90
-0.21%$0.717253
-2.00%$5,099.88
3.20%$3.03
-1.30%$0.995413
0.12%$128.33
0.22%$195.73
-0.71%$86.12
-2.48%$0.00000426
1.18%$1.00
0.00%$1.11
-0.01%$0.00000175
0.73%$0.999634
0.00%$1.19
-0.56%$9.75
0.10%$2.76
2.65%$0.999705
0.01%$0.062173
-0.61%$0.573772
-3.54%$0.16062
0.96%$0.00235423
-6.12%$0.284227
0.38%$0.998107
-0.07%$9.27
-1.02%$0.110205
-5.05%$0.413397
1.96%$8.03
-2.85%$5.89
-1.98%$0.140786
1.19%$2.08
4.05%$0.998604
-0.03%$4.23
-0.88%$67.41
-1.13%$1.27
0.05%$0.108644
2.79%$0.01677709
-21.78%$0.0333669
-0.27%$0.998995
0.01%$10.98
0.03%$0.00991049
-0.75%$0.04948511
1.76%$1.094
0.88%$1.57
-0.71%$0.808175
0.13%$0.134937
-0.72%$0.00859733
1.29%$1.024
0.00%$1.31
1.09%$1.11
0.48%$0.03644222
-2.51%$114.18
0.01%$1.24
0.14%$0.00000718
0.45%$0.082414
1.67%$0.193066
-1.09%$0.998806
-0.01%$0.995945
0.08%$0.087155
-2.93%$1.093
0.00%$0.302946
-0.12%$42.38
-3.95%$1.59
-0.04%$0.999432
-0.01%$0.482117
-0.78%$0.0274621
-2.23%$0.997309
0.02%$0.01257635
-2.87%$1.36
-2.76%$0.0075712
-1.52%$1.088
0.23%$76,248.00
-2.81%$0.04499227
2.61%$0.997398
-0.06%$0.224372
-2.32%$0.656991
1.21%$0.097781
-3.87%$0.185944
1.06%$1.18
0.24%$0.285539
-0.47%$0.998027
0.55%$0.997938
-0.14%$163.77
3.45%$1.13
-0.10%$0.109911
-0.37%$1.53
-11.18%$1.84
1.02%$3.66
-0.52%$0.316177
2.42%$0.04119969
-2.42%$0.01868582
-0.28%$0.51259
2.25%$0.060916
-0.14%$0.419863
0.73%$20.17
6.47%$0.379041
-4.72%$0.00000035
-1.03%$0.00003536
-0.85%$0.00000034
-2.69%$90.07
0.75%$0.375711
0.50%$0.076173
2.13%$0.02992314
-0.88%$116.29
1.33%$15.35
-1.24%$0.00611331
0.05%$0.999721
-0.00%$0.997504
0.37%$0.056553
-0.14%$0.050913
-0.84%$0.312917
1.74%$0.056276
0.58%$0.691304
2.55%$1.001
3.41%$14.30
-2.18%$0.00291184
-6.57%$0.993063
0.18%$0.00275607
-0.08%$2.18
-0.44%$17.36
-1.86%$0.099859
-0.72%$1.57
0.09%$0.147347
2.30%$6.86
-0.49%$1.56
1.14%$0.252666
-1.57%$0.02490958
5.17%$0.03367848
-3.15%$2.46
-1.40%$21.05
-0.13%$3.24
0.12%$0.998586
-0.18%$0.00478479
0.05%$0.221667
-0.83%$0.221442
0.48%$1.36
-2.68%$0.999995
0.00%$0.113686
0.10%$0.987442
0.00%$5,748.80
0.18%$0.999561
-0.04%$0.215822
0.41%$1.014
0.00%$0.00000101
-1.14%$0.096564
-4.69%$0.00003782
2.68%$0.00556698
-1.49%$1.073
0.01%$22.45
0.00%$0.11173
-1.02%$2.62
-0.18%$0.204027
-7.49%$0.00203929
-8.44%$0.01835774
1.41%$0.051584
-1.56%$20.11
0.55%$2.41
2.40%$0.053326
4.10%$1.00
0.00%$2.03
7.66%$0.123133
-1.39%$0.681768
-3.00%$0.058741
-2.86%$0.077711
-1.34%$0.00000897
-0.71%$2.28
-0.57%$0.177494
2.77%$0.00000198
0.00%$1.013
0.02%$0.17483
-4.07%$1.90
-1.04%$0.999712
-0.05%$0.911607
-6.20%$0.995867
-0.21%$2.57
0.76%$0.72516
4.11%$1.28
-0.04%$47.93
-0.07%$0.459445
-2.34%$1.00
0.00%$0.113692
-0.18%$0.993685
-0.01%$0.351565
-4.19%$0.09519
-1.31%$0.183305
-1.76%$0.331127
0.59%$1.23
0.39%$0.093952
0.24%$0.299905
4.37%$0.25528
0.64%$0.999313
0.09%$0.00483316
0.60%$4.96
2.66%$0.174723
7.55%$0.526813
-1.47%$0.294669
4.20%$0.079372
-3.81%$9.19
0.47%$0.137059
4.05%$0.337225
-0.49%$0.00162625
-4.40%$1,095.74
0.12%$0.14835
1.45%$0.00260069
0.62%$0.621207
0.69%$0.997788
-0.11%$2.66
1.15%$0.03398295
-6.28%$0.382817
-0.24%$0.297898
1.01%$0.00000063
-1.61%$0.02397909
-1.91%$0.01681416
-6.10%
Two reports released today tell the tale of two very disparate markets—Bitcoin and the US economy—and how drastically their paths may diverge as we emerge from the fog of financial uncertainty that has clouded 2020.
According to the New York Times, the Congressional Budget Office estimates that the United State’s gross domestic product (GDP) will suffer a $16 trillion blow in the decade ahead as a result of COVID-19 and related economic and financial fallout. After inflation, the final tally comes out to $7.9 trillion, which would dock three percentage points off of the United State’s total GDP from now until 2030.
The report casts a daunting shadow over the US during an already dark period.
Last weekend, riots rocked major cities nationwide in response to the police killing of George Floyd in Minneapolis, Minnesota. The riots erupted after nearly three months of national pandemic restrictions that have resulted in surging unemployment and economic instability.
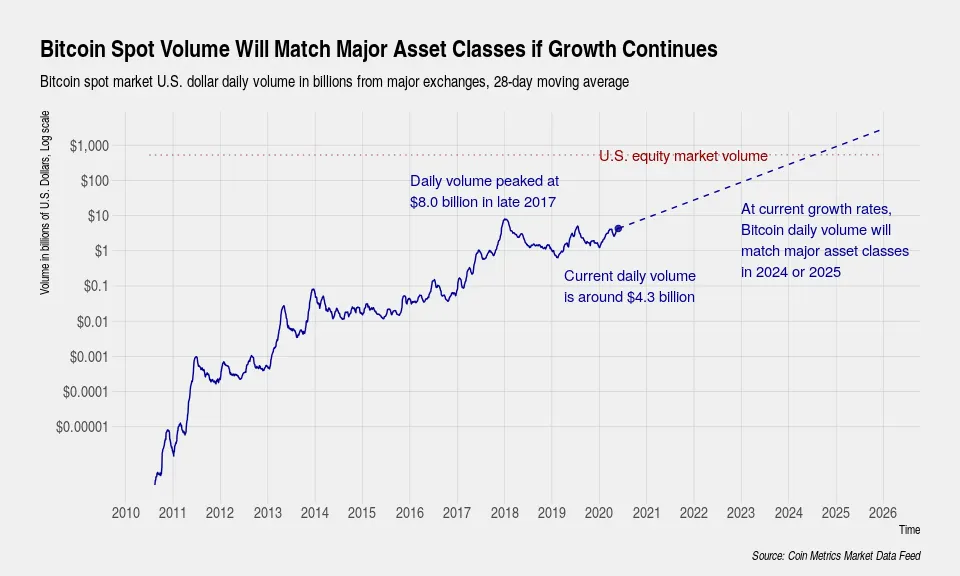
Meanwhile, Bitcoin analytics company CoinMetrics released its latest state of the network today with a more uplifting forecast, for crypto markets anyway: If Bitcoin continues to grow at the pace its set over the past decade, its daily volume will match US equities trading by 2024 and US bonds trading by 2025.
With Bitcoin’s daily spot volume in the ballpark of $4.1 billion (and $8 billion at its peak in 2017), then it won’t take that much longer for Bitcoin to reach equities and bond trading levels, CoinMetrics wrote in its report, or around $1 trillion in daily volume.
“If historical growth rates can be maintained, however, Bitcoin’s current daily volume from spot markets of $4.3 billion would need fewer than 4 years of growth to exceed daily volume of all U.S. equities. Fewer than 5 years of growth are needed to exceed daily volume of all U.S. bonds.”

So even if US GDP shows signs of slipping, there’s plenty of room for growth in Bitcoin’s burgeoning market, according to Coin Metrics.
Maybe that “digital gold” meme isn’t so far-fetched after all.
Disclaimer
The views and opinions expressed by the author are for informational purposes only and do not constitute financial, investment, or other advice.


