Technical analysis is a key tool in the arsenal of many cryptocurrency traders, helping them to make sense of the market’s ebbs and flows.
But technical analysis isn’t deterministic. It doesn’t tell you what will definitely happen, but rather, what’s likely to happen given the historical information as analyzed through the study of charts. For it to be effective, however, it needs to be done accurately, which is the tricky bit.
Whether trading or investing, cryptocurrencies come with huge risks as well as opportunities, due to their extreme volatility—so proceeding with caution is advised.
What is technical analysis?
Technical analysis is the study of price movements through the use of charts. Traders use TA to make money from price changes, even when a cryptocurrency goes down.
The main assumptions of TA include the following:
- All information is reflected in the price
- Human psychology tends to repeat over time
- Statistical analysis can help uncover what the price may do next
TA isn’t for everyone.
Although some think major cryptocurrencies like Bitcoin can go to zero, many in crypto think that the “secular trend”—similar to “long-term direction”—of major coins like Bitcoin is upward. For that reason and others like taxes, they prefer to invest long-term and just HODL. For HODLing, no TA is necessary, of course.
What are candlestick charts?
On 23 February 2021, Decrypt reported that, “Yesterday, crypto analysts were admiring (if you can call it that) Bitcoin’s daily red candle wick—that is, the minimum point reached before reversing the trend during the day. But today, the market is faced with the largest red-bodied candle in Bitcoin's history.”
Concepts like candle body, wick and colors are key to TA.
A candlestick on a chart contains the following:
- Time: 1 minute, 5 hours, 1 day, 1 week… depends on what time frame you’re charting
- Open and close prices at the start and end of that time interval, contained in the candlestick’s body
- The highest and lowest point price reached during the time interval is reflected by thin lines sticking out of the body (but not part of it) called wicks
- Color: red (price is down) and green (price is up), or any other color combination of preference
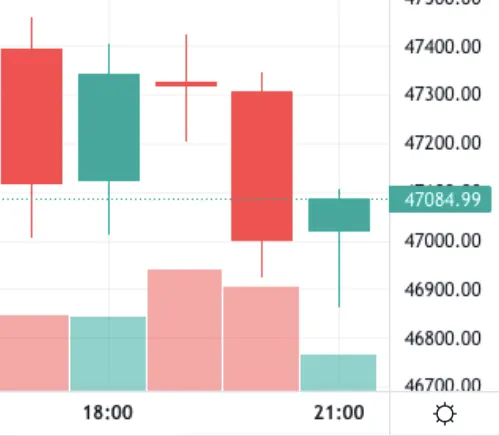
Here’s how Bitcoin’s candlesticks look on a simple hourly chart from 31 August 2021:

Many traders envisage the color (price direction) changes in candlesticks as a battle between sellers and buyers, or bears and bulls.
Bears pushing for a 4th very ugly daily candle. pic.twitter.com/huW7yHSKuF
— Payne (@Tradermayne) May 18, 2021
It’s important not to confuse a wick with a candlestick’s full body. The body contains information about the open and close prices in that time frame, and wicks represent failed attempts.
In the chart above, you can see failed attempts represented by wicks at 5pm and 6pm (UK time) on 31 August 2021: Bitcoin almost fell close to lows of $47,000 but bounced back each time. And at 8pm, you can see that bearish attempt succeeding but this time a further attempt to take it below $47,000 getting rejected... at least for that hourly period.
The example here uses an hourly chart. But lower-timeframe charts tend to be more volatile and contain less useful information than a chart with a higher timeframe. Traders using TA tend to combine different time periods to make sense of the overall picture.
Did you know?
Like most TA concepts and tools, candlesticks don’t originate from the cryptocurrency market. Candlesticks were first used in the rice derivatives exchanges of 18th-century feudal Japan!
What are support and resistance levels?
In February 2020, Decrypt wrote, “[Bitcoin] has fallen down to $8,979 before recovering just slightly above the $9,000 price point. But the psychological support level may not last long.”
And when Bitcoin surpassed $15,000 in November 2020, market analysts told Decrypt Bitcoin broke through a resistance level.”
A support level is a price point where a lot of buyers are expected to step in; conversely, a resistance level is where many typically sell. When a cryptocurrency breaks a resistance level, that means a price point at which a lot of people would previously sell no longer see it as an attractive price point to sell. Technical analysts may judge a previous resistance level to be the new support level if the price is expected to jump whenever it hits that level.
Often, support and resistance levels are price points that are neatly round in USD terms, such as $15,000 or $65,000. A price point like $17,484 is too psychologically random to become a support or resistance level.
What do traders do with support and resistance levels?
Traders make key decisions at support and resistance levels. If they think the cryptocurrency will bounce back at a price point, they will “enter” at that support level: buy that particular cryptocurrency. And when the price reaches what they think is the resistance level, they will “exit” or sell that cryptocurrency.
Traders with a high appetite for risk may choose leverage trading, which is a form of price betting and amplifying gains (or losses). Some exchanges allow traders to open “long” and “short” positions with leverage, meaning that you bet on the price of a cryptocurrency going down or up with the funds you borrow. Longing is bullish, ie. a trader expects the price will go up and is willing to put their funds as collateral. Shorting is the opposite.
Leverage trading can be extremely risky; traders stand to earn or lose two, five or even 100 times more than they would regular market orders. Many cryptocurrency exchanges have recently started phasing out such high leverages.
Identifying support and resistance levels
TA uses many different tools and techniques to identify support and resistance levels, and traders sometimes differ in their conclusions depending on how they deploy these tools.
One of the most common techniques is Fibonacci retracement.
$BTC USD
If I could only have one tool to use in a bull market, it would be Fibonacci levels. A weekly close above $17200 will be extremely bullish.
Bulls are starting to show strength, bears are sweating. pic.twitter.com/m0rngUlheV
— Koroush AK (@KoroushAK) November 28, 2020
You might vaguely remember the concept of “Fibonacci numbers” from high-school math class. They’re numbers in a sequence 1.618 times the preceding number. That’s useful for calculating how many rabbits may reproduce under perfect conditions.
It’s also useful for cryptocurrency traders because it allows taking the extreme points (the highest and lowest prices in a given time frame) and dividing the distance by the Fibonacci ratios of 23.6%, 38.2%, 50%, 61.8% and 100%, to help identify potential resistance and support levels. It may sound complicated, but popular TA platforms like TradingView allow you to chart Fibonacci retracements with just a couple of clicks.
But support and resistance levels alone don’t provide enough information for traders, so they’ll turn to other supplementary techniques.
Bollinger bands are a popular supplementary tool. It allows you to draw three lines: typically a 20-day simple moving average (the price direction over that period), an upper band, and a lower band. Traders look at these bands to assess the strength of a trend and decide the best time to enter the market.
If a cryptocurrency lies above the upper band, it’s considered overbought, and traders will stay away. If it’s below the lower band, then it’s considered undersold, which makes it an attractive trade to enter.
To draw these lines, Bollinger bands use another elementary concept from math, standard deviation, to determine where the upper and lower bands lie. The more volatile the market, the wider the distance of the bands.
Going short here.....
Ugly price action with volatility and bollinger band width at an extremely low level... Expecting a very big move soon. My bet is a move down. pic.twitter.com/q4NYwKvWXf
— Altcoin Psycho (@AltcoinPsycho) September 25, 2018
Bollinger bands also help traders understand where the price may go after support and resistance reversals.
Reversals are bullish or bearish changes in price, and they’re often recurring patterns. Traders try to identify those patterns with sometimes amusing names like “a cup and handle.”
Rejected cup and handle ➡️ Bearish🐻 ( $BTC USD Shorts)
Near completion of ascending triangle ➡️ Bullish🚀 ( $BTCUSD Longs)
Something big is near. #Bitcoin pic.twitter.com/Ch09sJZf4J
— K A L E O (@CryptoKaleo) June 28, 2018
Fundamental vs technical analysis
Fundamental analysis (FA) is another widely employed technique for gauging the value of cryptocurrencies.
FA looks at “fundamentals” that support or undermine a cryptocurrency: the technical elements of the underlying blockchain, problems the blockchain project seeks to solve, potential issues around legality, the team behind it, the whitepaper and the roadmap…
In traditional markets, a lot of information about companies is either not public or reported only quarterly. In crypto, it’s possible to evaluate projects based on real-time on-chain metrics, which may include hash rates, transaction volumes, the ownership distribution among wallets and their movements.
Investors tend to use FA when making a decision about putting money into a project over a relatively long period of time, on the assumption that the markets will reward robust projects.
Limitations of technical analysis
Although FA and TA aren’t mutually exclusive and technical analysts tend to think fundamentals are already reflected in crypto prices (a big debate), there are inevitable limitations.
Fundamental analysts think the price doesn’t always reflect true fundamentals—if, for example, not everything about a project is widely known by traders. And when that piece of information becomes more widely known, that may impact the price.
But both inevitably suffer from limitations, such as unexpected and sudden regulatory moves targeting cryptocurrencies; the industry often labels these as FUD (fear, uncertainty and doubt).
Some argue that TA is perhaps a collective self-fulfilling prophecy. When traders make predictions and act accordingly, the price reflects those changes, confirming what they thought would happen in the first place.
And when techniques are deployed poorly or unpredictable factors dominate the market significantly, TA becomes anything but helpful.
Even those well-versed in TA can get analyses wrong. In 2019, mainstream news site CNBC’s Bitcoin price reporting became a running gag: when mapped on a TradingView chart, 95% of the time, the opposite of what trade analysts told CNBC to expect happened.
So again, DYOR and trade with caution!
Disclaimer
The views and opinions expressed by the author are for informational purposes only and do not constitute financial, investment, or other advice.
Sponsored post by Saidler & Co.
Learn More about partnering with Decrypt.


